ReHo
ReHo is calculated as the Kendall’s coefficient of concordance (KCC) among a seed voxel and its neighbor voxels, which indicates the degree of spontaneous activity in the seed voxel’s vicinity. Voxels of higher intensity in ReHo maps indicate greater similarity among neighboring voxels’ time series.
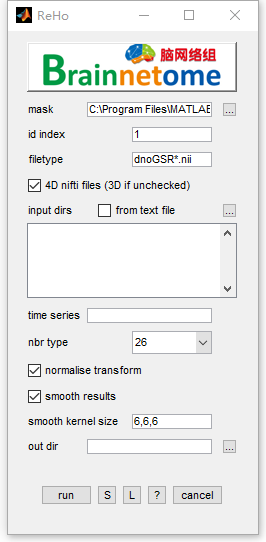
- mask: could be whole brain mask or gray matter mask.
- id index: identifier to find unique string for each subject
- filetype: files in the filetype will be searched in input directories.
- 4D nifti files: if the input data is 4D, check this item. Otherwise uncheck.
- input dirs: directories can be input either using a
*.txtfile or spm select window. - time series: choose the time series to calculate, seperated by ‘,’.
- nbr type: number of neighbor voxels, 6 face neighbor, 18 for edge neighbor and 26 for vertex neighbor.
- normalize transform: in output file, a suffix of _m means the output is divided by mean intensity in the mask.
- out dir: output directory for saving results.
- Buttons:
- S: Save parameters of the current panel to a
*.matfile. The*.matcan be further loaded for the panel or be used in a script processing. - L: Load parameters from
*.matfor the current panel. - ?: Help information.
- S: Save parameters of the current panel to a
- Reference:
- Zang Y, Jiang T, Lu Y, He Y, Tian L. Regional homogeneity approach to fMRI data analysis. Neuroimage 2004; 22(1): 394-400.