ROI Mapping
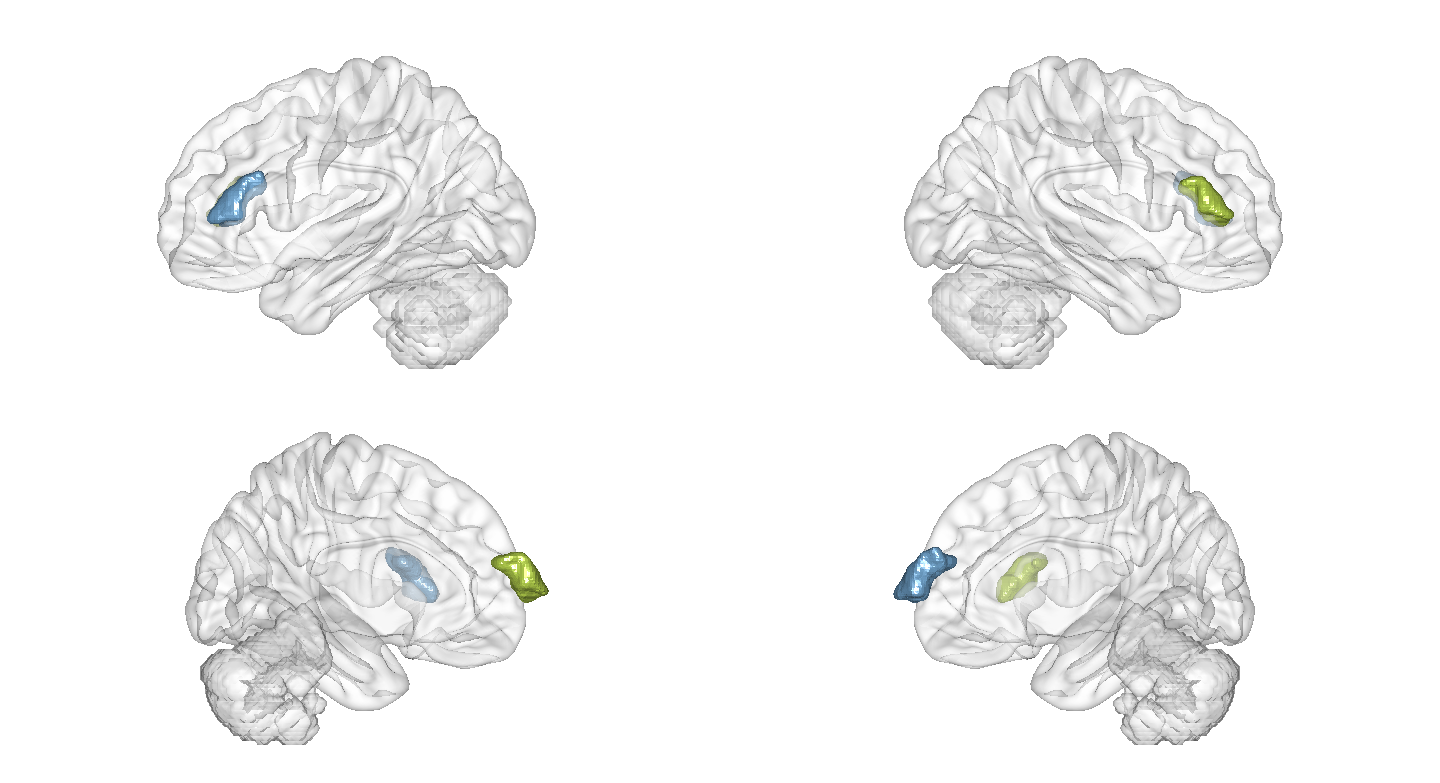
When visualizing ROIs from an atlas or clusters from a user-defined 3D volume (e.g., clusters with significant difference between sample means), we can use the current function to extract and shade the surface of each number-tagged ROI/cluster in random or user defined colors. The ROIs/clusters of the input 3D image should be tagged with positive-integers. With an additional input of a reference *.csv table containing number-label pairs (as described in Utilities -> DICOM Convert), we can further parse the labels of each shaded ROI/cluster and present them in a legend.
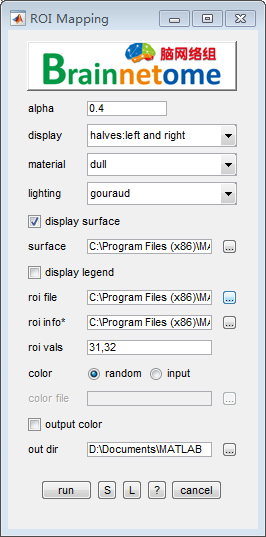
alpha: degree of transparency.
display: mode of display.
display surface: show surface.
surface: surface file.
display legend: display legend.
roi file: extract mean intensity in the roi tagged by numbers.
roi info*: optional. two columns of information for each labeled cluster in a
*.csvfile. For example:1,SFG 2,MFG 3,IFG
roi vals: select which roi to display.
color: optional. use random color or input color file.
color file: the input color could be (ROI tag, R, G, B):
1,255,155,100
2,1,1,1
output color: output color of current image.
out dir: output directory for saving results.
- Buttons:
- S: Save parameters of the current panel to a
*.matfile. The*.matcan be further loaded for the panel or be used in a script processing. - L: Load parameters from
*.matfor the current panel. - ?: Help information.
- S: Save parameters of the current panel to a