STEP 8: Visualization
- Surface Mapping
- Click the VIEW button, then Surface Mapping. Select material, lighting and shading if necessary.
- ROI Mapping
- Click ROI Mapping button in VIEW GUI. Select material, lighting and shading if necessary.
- Network Visualization
- Click Network Visualization button in VIEW GUI. Open the node directories selection GUI and find the
brant_roi_info.csvfile where ROI Calculation in STEP 4 outputs. Open the edge directories selection GUI and find thettest2_grp1_vs_grp2_h_unc.txtfile where T-Tests in STEP 6 outputs.
- Circos
- Click the Embedded button, then Circos. Select the circos’ directories as input or circos dir, e.g.
D:/circos-0.69-5/bin. ROI info can use the examplebrant_circos_3mm_273.csvfile in*/Matlab/toolbox/brant-master/circos. Open the edge directories selection GUI and find thettest2_grp1_vs_grp2_h_unc.txtfile where T-Tests in STEP 6 outputs.
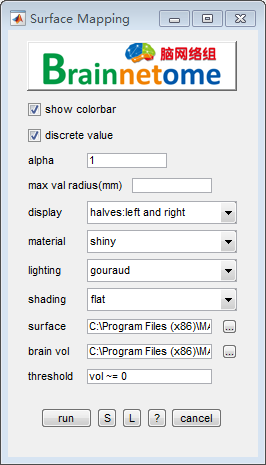
fig.1 VIEW => Surface Mapping
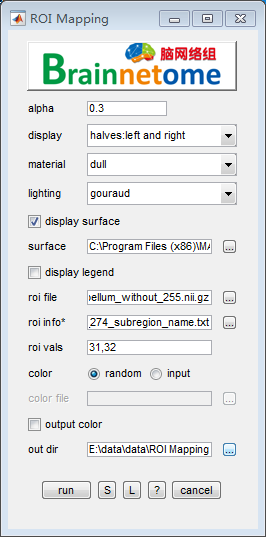
fig.2 VIEW => ROI Mapping
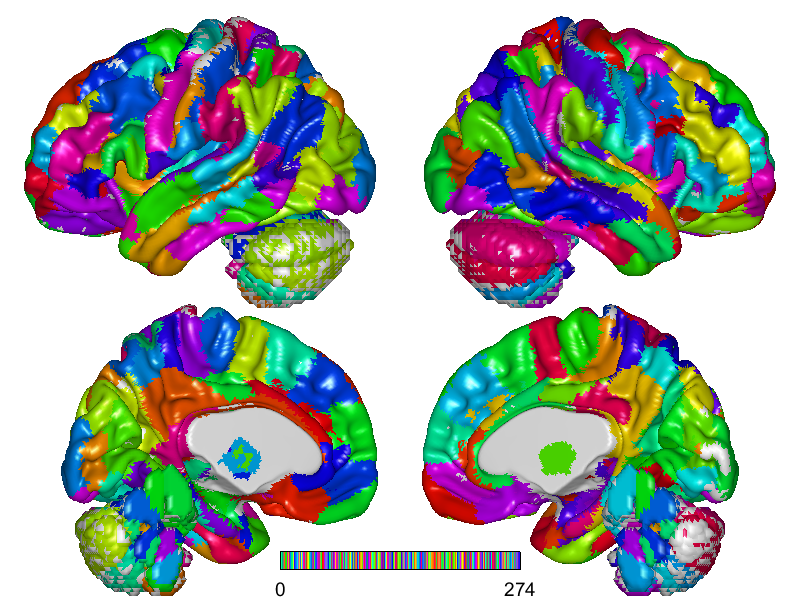
fig.3 Result of Surface Mapping
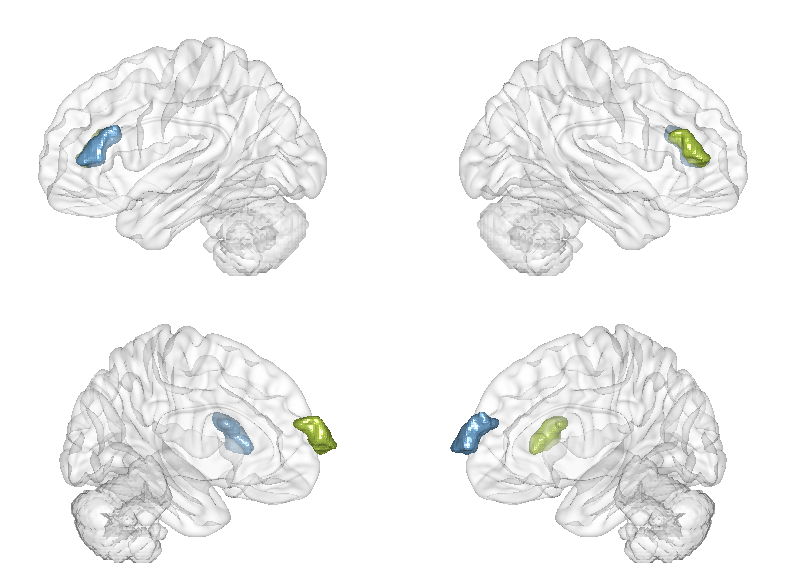
fig.4 Result of ROI Mapping
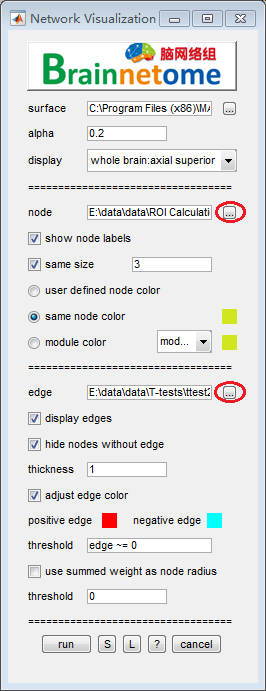
fig.5 VIEW => Network Visualization
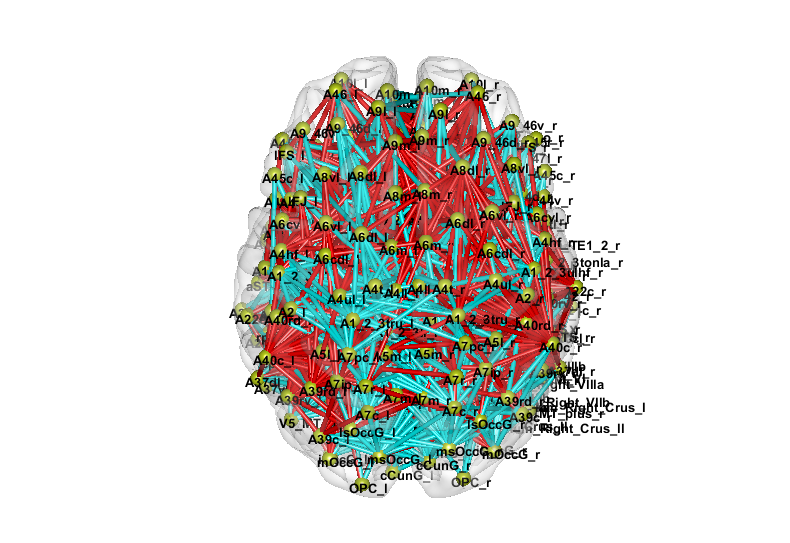
fig.6 Result of Network Visualization
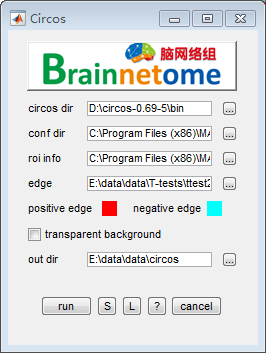
fig.7 Embedded => Circos
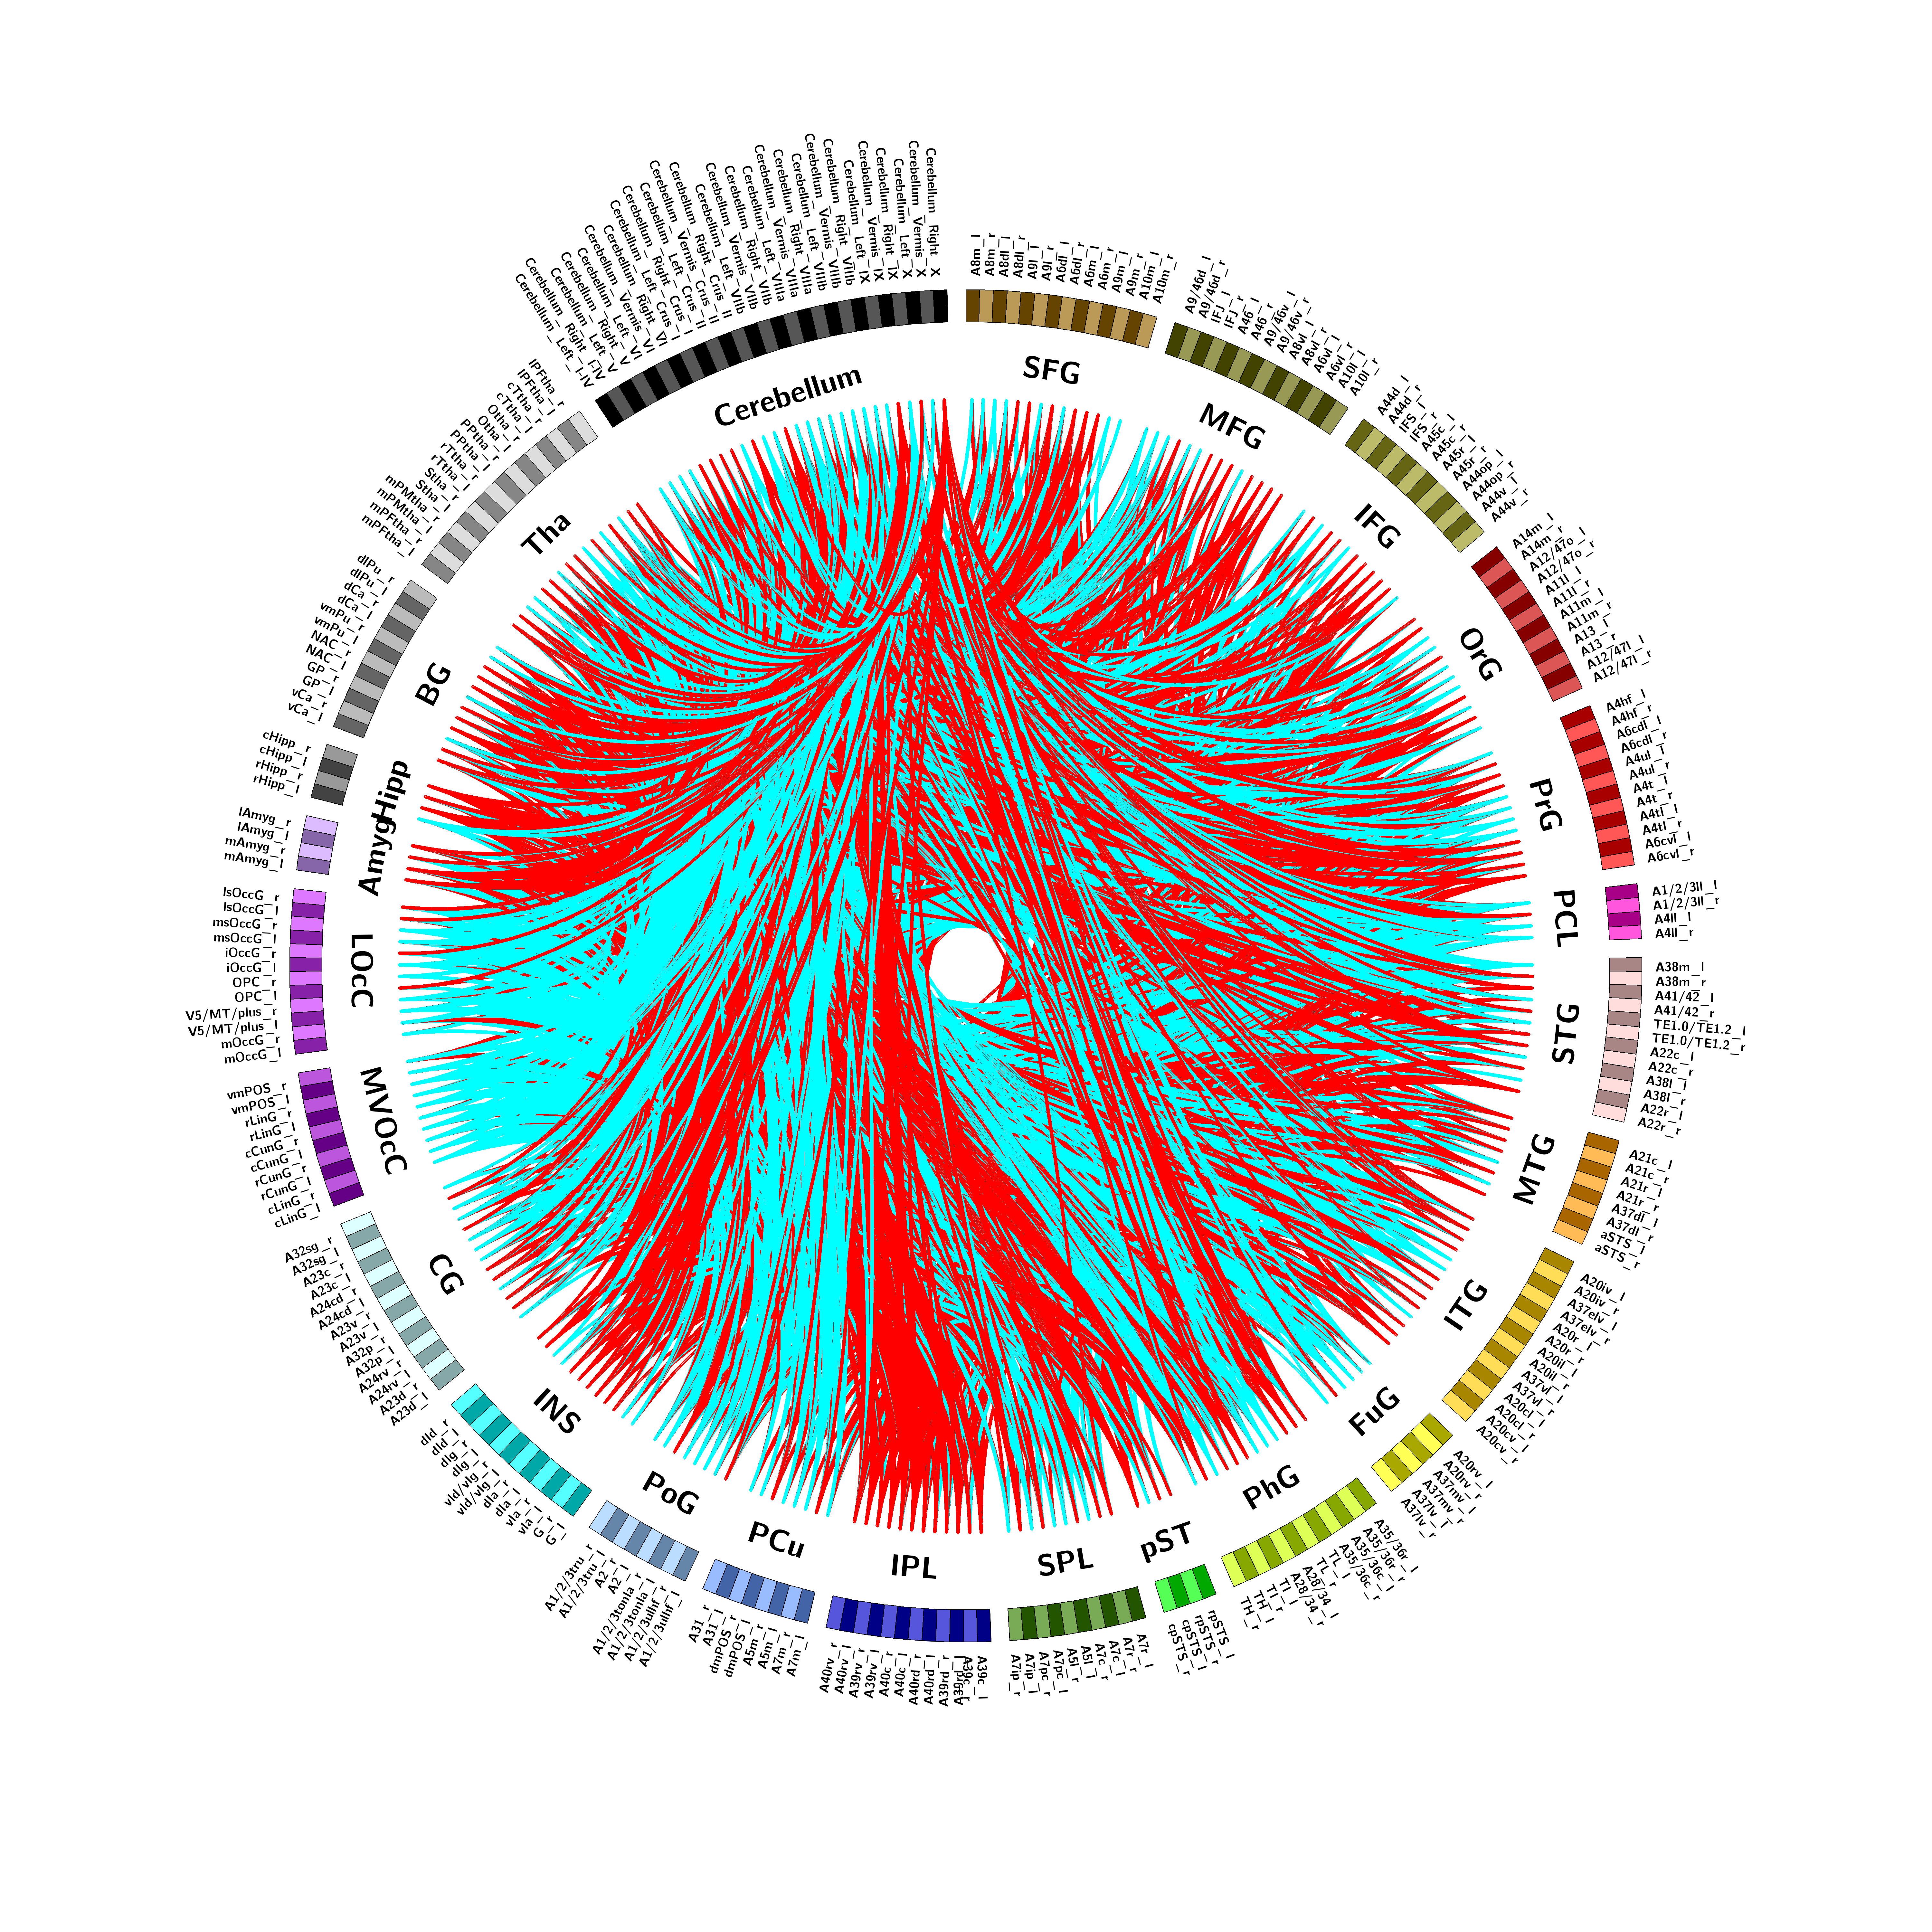
fig.8 Result of Circos