Result of rs-fMRI data analysis
To validate the efficacy of our toolkit, we used the same preprocessing pipelines provided by BRANT and DPABI v2.3, to compare ReHo, fALFF and FCs using a rs-fMRI dataset consists of 18 patients with mild cognitive impairment (MCI), 17 patients with mild Alzheimer’s disease (mAD), 18 patients with severe Alzheimer’s disease (sAD) and 21 normal controls (NC). This dataset is available online.
AD subjects were diagnosed using standard operationalized criteria (Diagnostic and Statistical Manual of Mental Disorders, Fourth Edition (DSM-IV); American Psychiatric Association 1994 and National Institute of Neurological and Communicative Disorders and Stroke - Alzheimer’s Disease and Related Disorders Association (NINCDS-ADRDA)). The severity of dementia was assessed using the Clinical Dementia Rating (CDR) scale. Patients with a diagnosis of AD and CDR score of 1 were classified as mild AD and those with a CDR score of 2 or 3 were diagnosed as severe AD. MCI was diagnosed according to standard criteria, which included subjective memory loss with objective evidence of memory impairment in the context of normal or near-normal performance on other domains of cognitive functioning; minimal impairment of activities of daily living with a CDR score of 0.5. Normal volunteers have a CDR score of 0.
The MR images were acquired on a 3.0-T MR scanner (Magnetom Trio, Siemens, Germany). Functional MRI data were acquired using an echo planar imaging (EPI) sequence sensitive to BOLD contrast: Repetition time (TR) = 2000 ms, echo time (TE) = 30 ms, flip angle (FA) = 90°, matrix = 64 × 64, field of view (FOV) = 220 mm × 220 mm, slice thickness = 3 mm with inter-slice gap = 1 mm. Each brain volume comprised 32 axial slices, and each scanning session lasted for 360 s. Sagittal T1-weighted MR images were acquired by a magnetization-prepared rapid gradient-echo sequence (TR/TE = 2000/2.6 ms, FA = 9°, matrix = 256 × 224, FOV = 256 mm × 224 mm, 176 continuous sagittal slices with 1 mm thickness).
No significant differences (P>0.05) of age (two-tailed two sample t-test), gender (chi-squared test) and education (two-tailed two sample t-test) were found between each patient group and NC group. T-statistic maps of fALFF, ReHo and results of FCs (P<0.001, uncorrected) based on different toolkits have quite similar patterns, which suggest BRANT is another optimal toolkit for rs-fMRI research community. In the results, the minor differences can be induced by 489 different implementations of trends removal, covariance regression and band-pass filter. For the results, we didn’t draw a strong conclusion, since the interpretation requires multiple comparison corrections and is not the main point of the current study.
We have listed the differences among BRANT and other Matlab-based toolboxes in FAQs. We can also find that t-statistic maps of fALFF, ReHo and results of FCs (P<0.001, uncorrected) based on different toolkits have quite similar patterns, which suggest BRANT is another optimal toolkit for rs-fMRI research community.
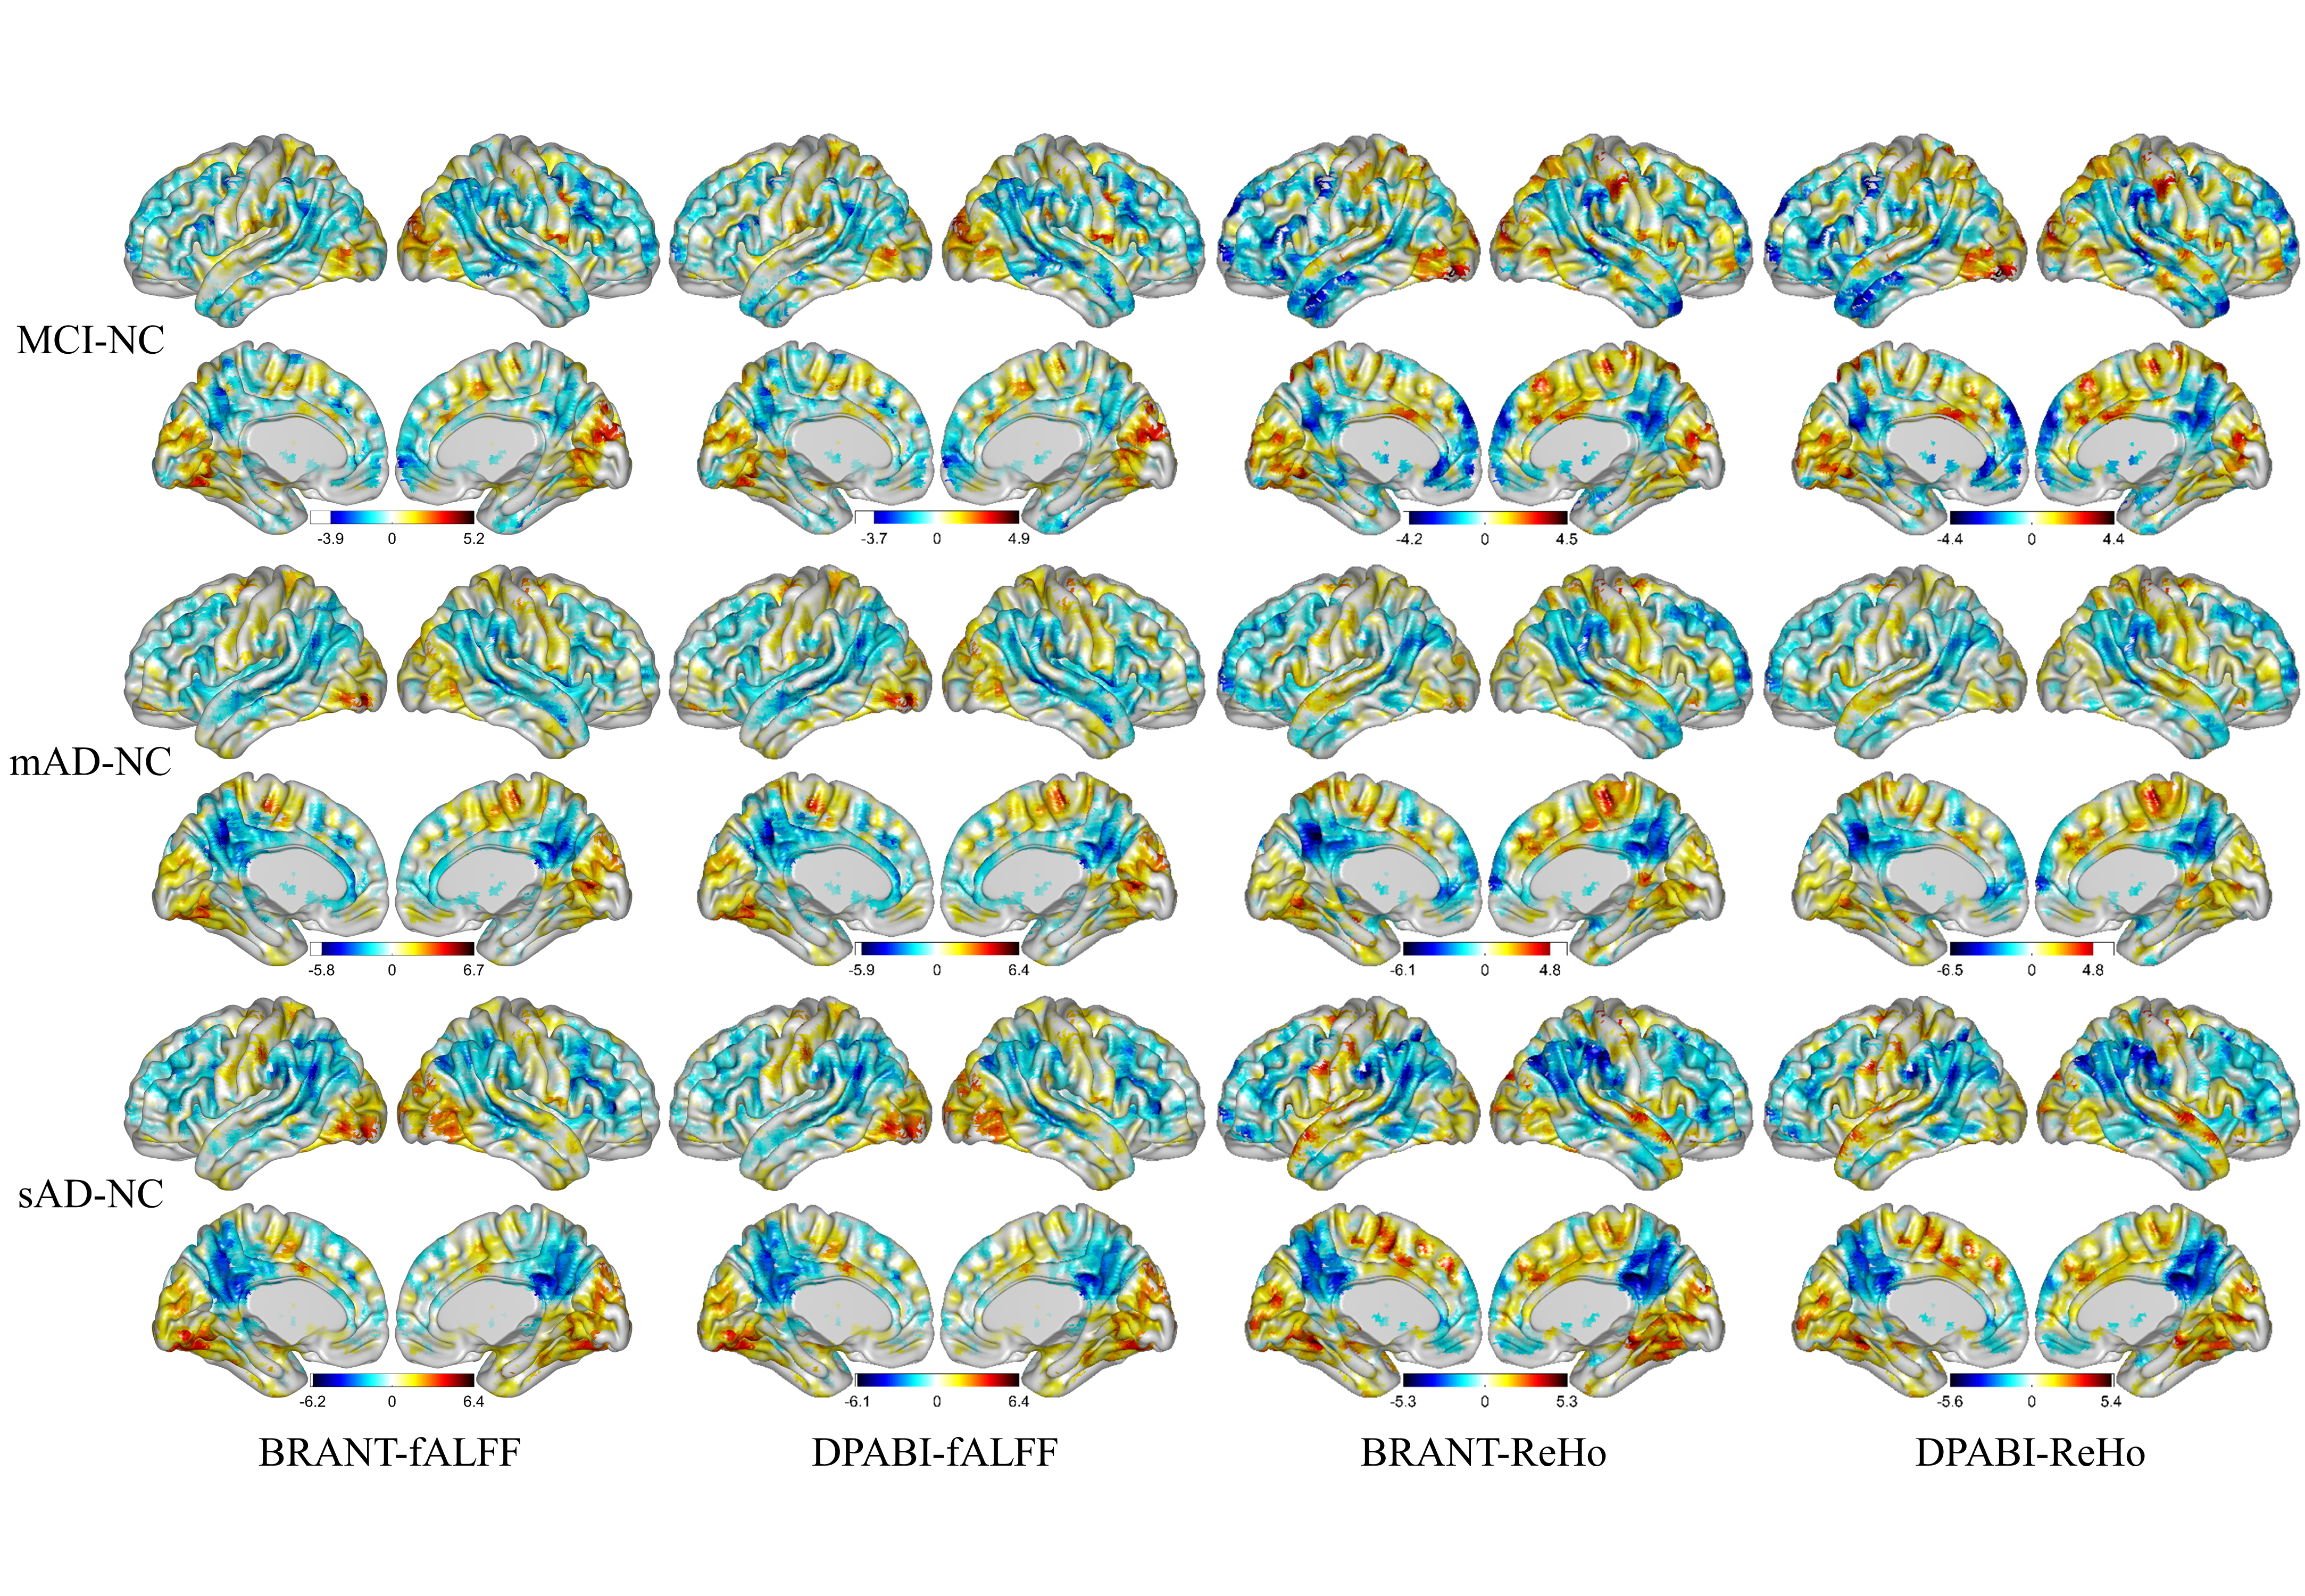
fig.1 T-statistic maps of fALFF and ReHo based on different toolkits
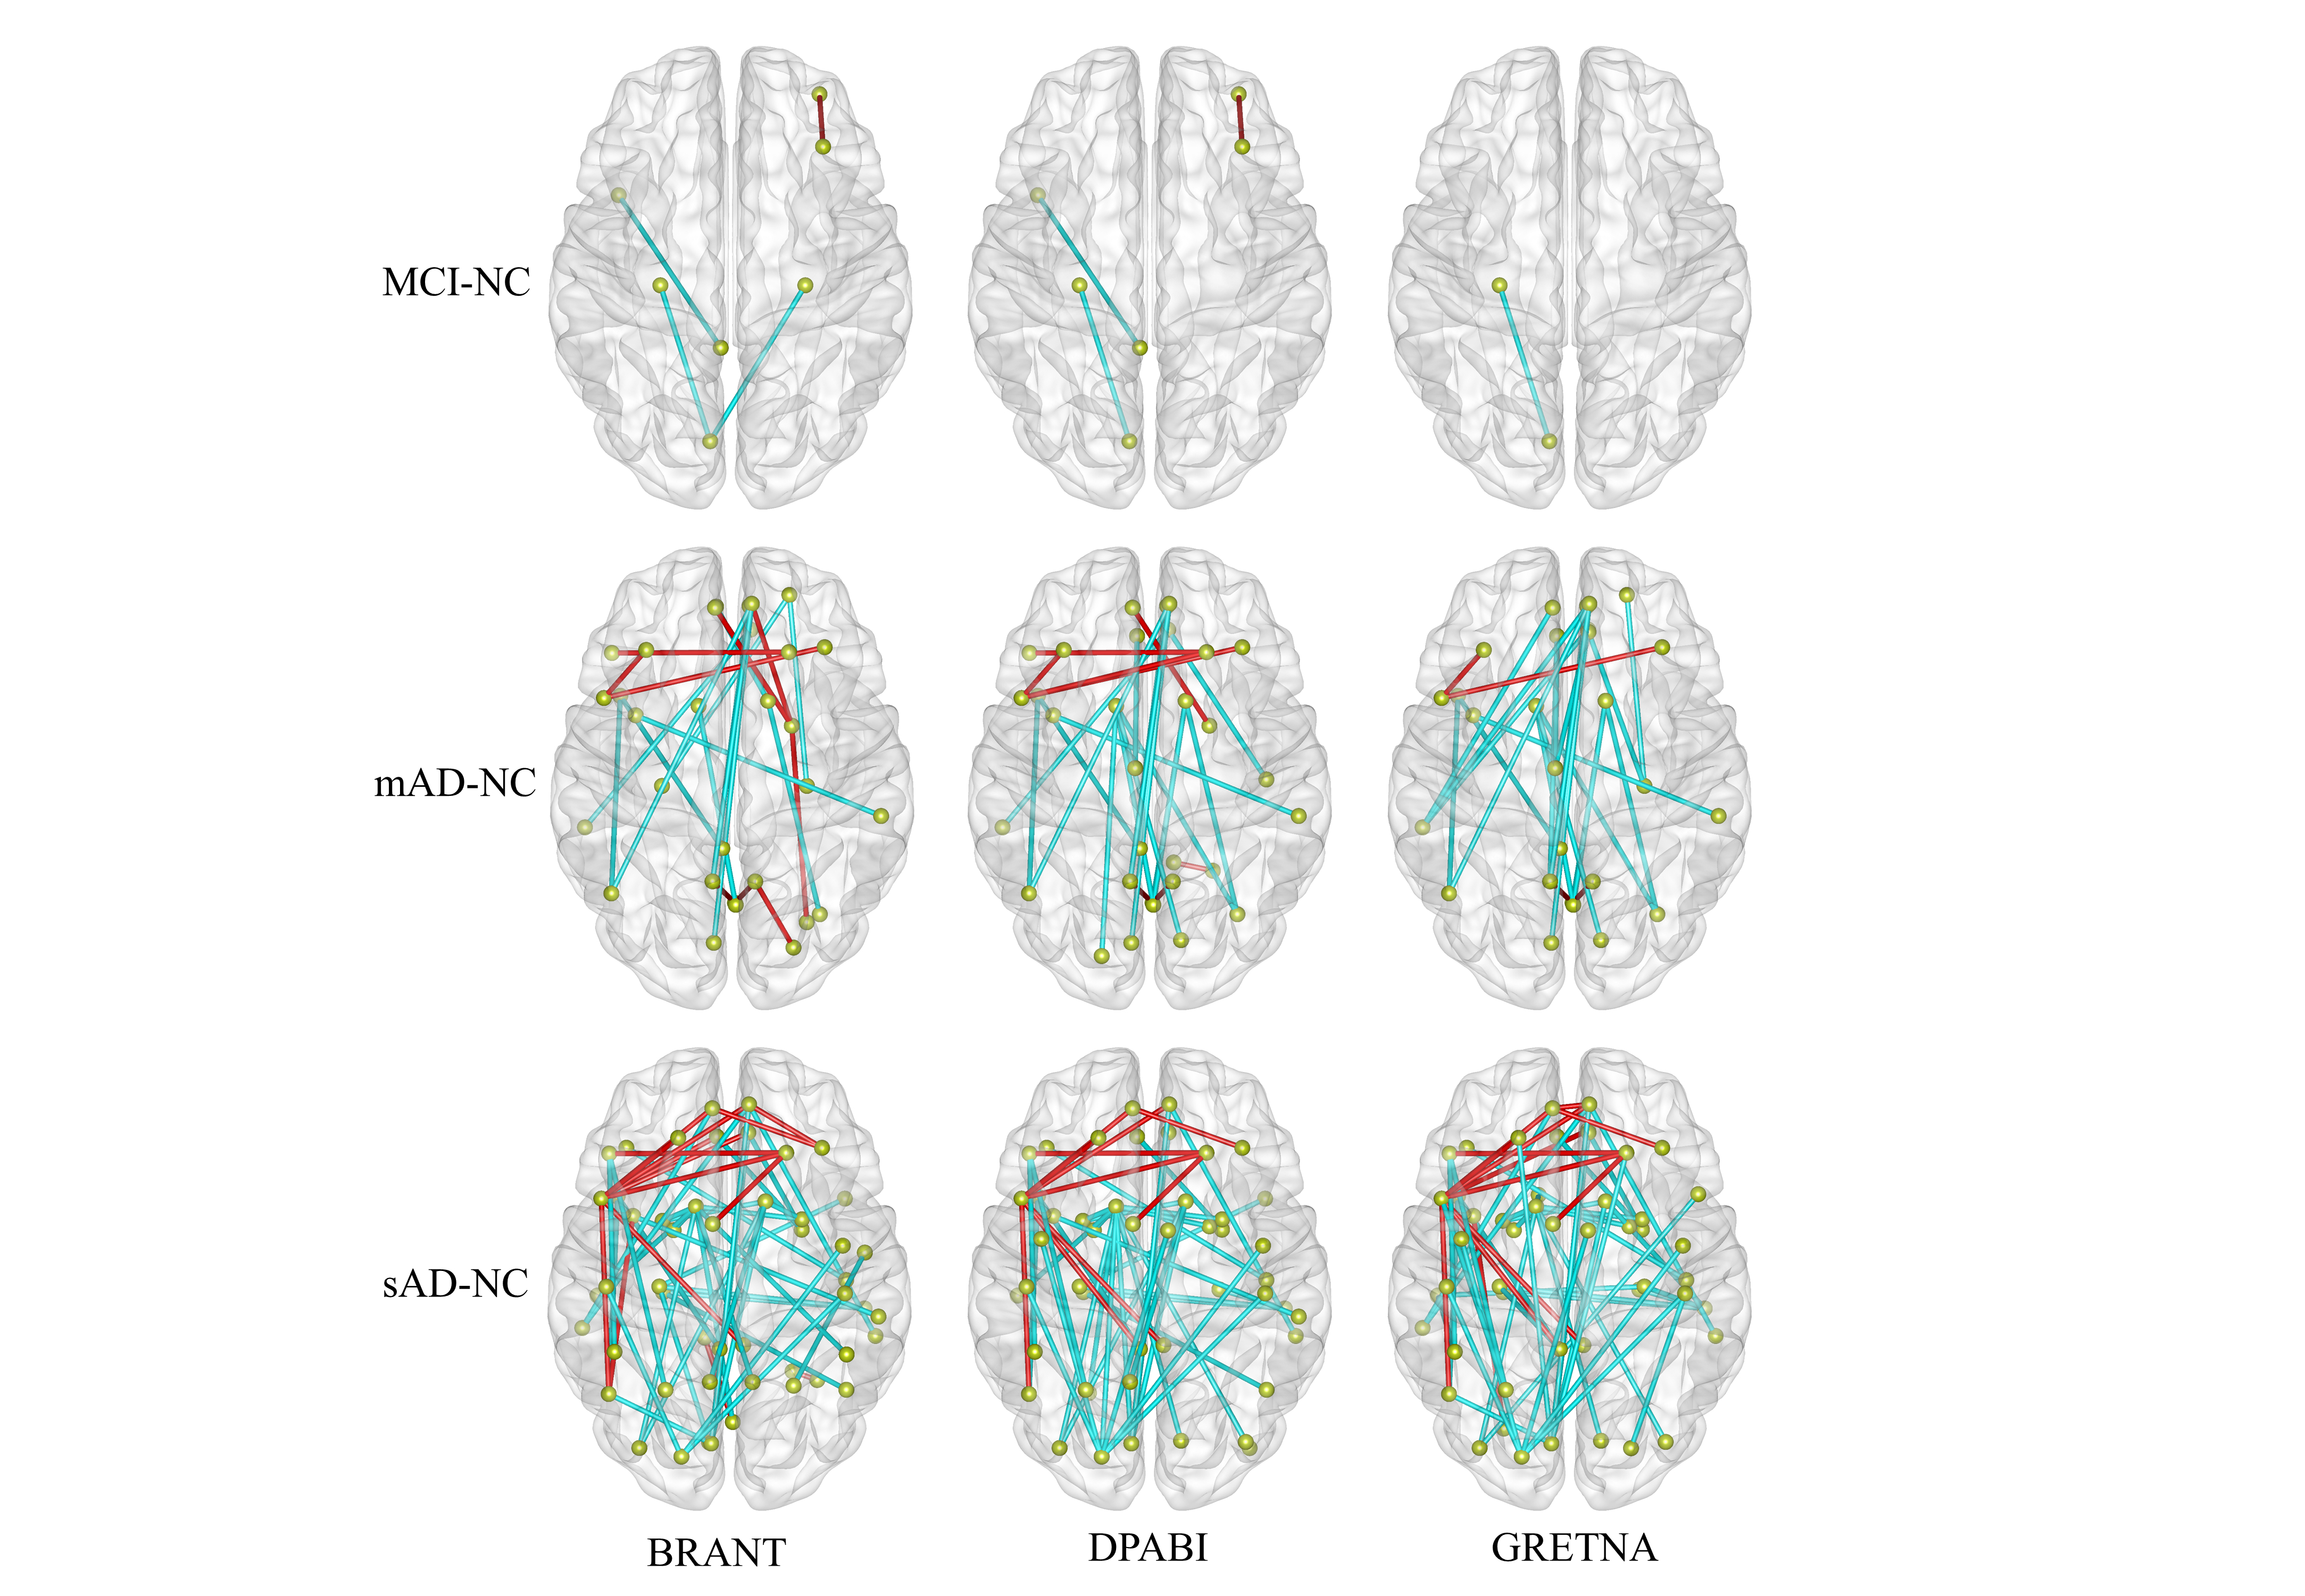
fig.2 results of FCs based on different toolkits
- References:
- Yan CG, Wang XD, Zuo XN, Zang YF. DPABI: Data Processing & Analysis for (Resting-State) Brain Imaging. Neuroinformatics 2016; 14(3): 339-51.
- Wang J, Wang X, Xia M, Liao X, Evans A, He Y. GRETNA: a graph theoretical network analysis toolbox for imaging connectomics. Front Hum Neurosci 2015; 9: 386.
- Whitfield-Gabrieli S, Nieto-Castanon A. Conn: a functional connectivity toolbox for correlated and anticorrelated brain networks. Brain Connect 2012; 2(3): 125-41.
- Zuo XN, Kelly C, Di Martino A, Mennes M, Margulies DS, Bangaru S, et al. Growing together and growing apart: regional and sex differences in the lifespan developmental trajectories of functional homotopy. J Neurosci 2010; 30(45): 15034-43.
- Liu Y, Yu C, Zhang X, Liu J, Duan Y, Alexander-Bloch AF, et al. Impaired long distance functional connectivity and weighted network architecture in Alzheimer’s disease. Cereb Cortex 2014; 24(6): 1422-35.
- He X, Qin W, Liu Y, Zhang X, Duan Y, Song J, et al. Abnormal salience network in normal aging and in amnestic mild cognitive impairment and Alzheimer’s disease. Human brain mapping 2014; 35(7): 3446-64.
- Liu J, Zhang X, Yu C, Duan Y, Zhuo J, Cui Y, et al. Impaired Parahippocampus Connectivity in Mild Cognitive Impairment and Alzheimer’s Disease. J Alzheimers Dis 2016; 49(4): 1051-64.
- McKhann G, Drachman D, Folstein M, Katzman R, Price D, Stadlan EM. Clinical diagnosis of Alzheimer’s disease: report of the NINCDS-ADRDA Work Group under the auspices of Department of Health and Human Services Task Force on Alzheimer’s Disease. Neurology 1984; 34(7): 939-44.
- Morris JC. The Clinical Dementia Rating (CDR): current version and scoring rules. Neurology 1993; 43(11): 2412-4.
- Petersen RC, Smith GE, Waring SC, Ivnik RJ, Tangalos EG, Kokmen E. Mild cognitive impairment: clinical characterization and outcome. Arch Neurol 1999; 56(3): 303-8.
- Petersen RC, Doody R, Kurz A, Mohs RC, Morris JC, Rabins PV, et al. Current concepts in mild cognitive impairment. Arch Neurol 2001; 58(12): 1985-92.
- Choo IH, Lee DY, Youn JC, Jhoo JH, Kim KW, Lee DS, et al. Topographic patterns of brain functional impairment progression according to clinical severity staging in 116 Alzheimer disease patients: FDG-PET study. Alzheimer Dis Assoc Disord 2007; 21(2): 77-84.